Web Dashboard
The web dashboard gives you a visual interface for portfolio monitoring, weekly review browsing, and per-symbol data exploration. It is a single-page app (React + Vite) that reads from the same API the CLI uses.
Security: Local use only
The dashboard is designed for local use on localhost. Do not bind the API server or frontend to 0.0.0.0 or expose it on a public network unless you fully understand the risks — there is no authentication layer.
If you need remote access, use an SSH tunnel:
# From your local machine, forward both API and frontend ports:
ssh -L 8000:localhost:8000 -L 5173:localhost:5173 your-server
Then open http://localhost:5173 in your browser as usual.
Starting the dashboard
The dashboard requires both the API server and the frontend dev server.
# Terminal 1 — start the API
uvicorn openfin.api.main:app --host 127.0.0.1 --port 8000

# Terminal 2 — start the frontend
cd frontend
npm run dev
Open http://localhost:5173 in your browser. The root URL redirects to the Portfolio view.
Views
Portfolio
The default landing page. Shows a real-time snapshot of your brokerage positions.
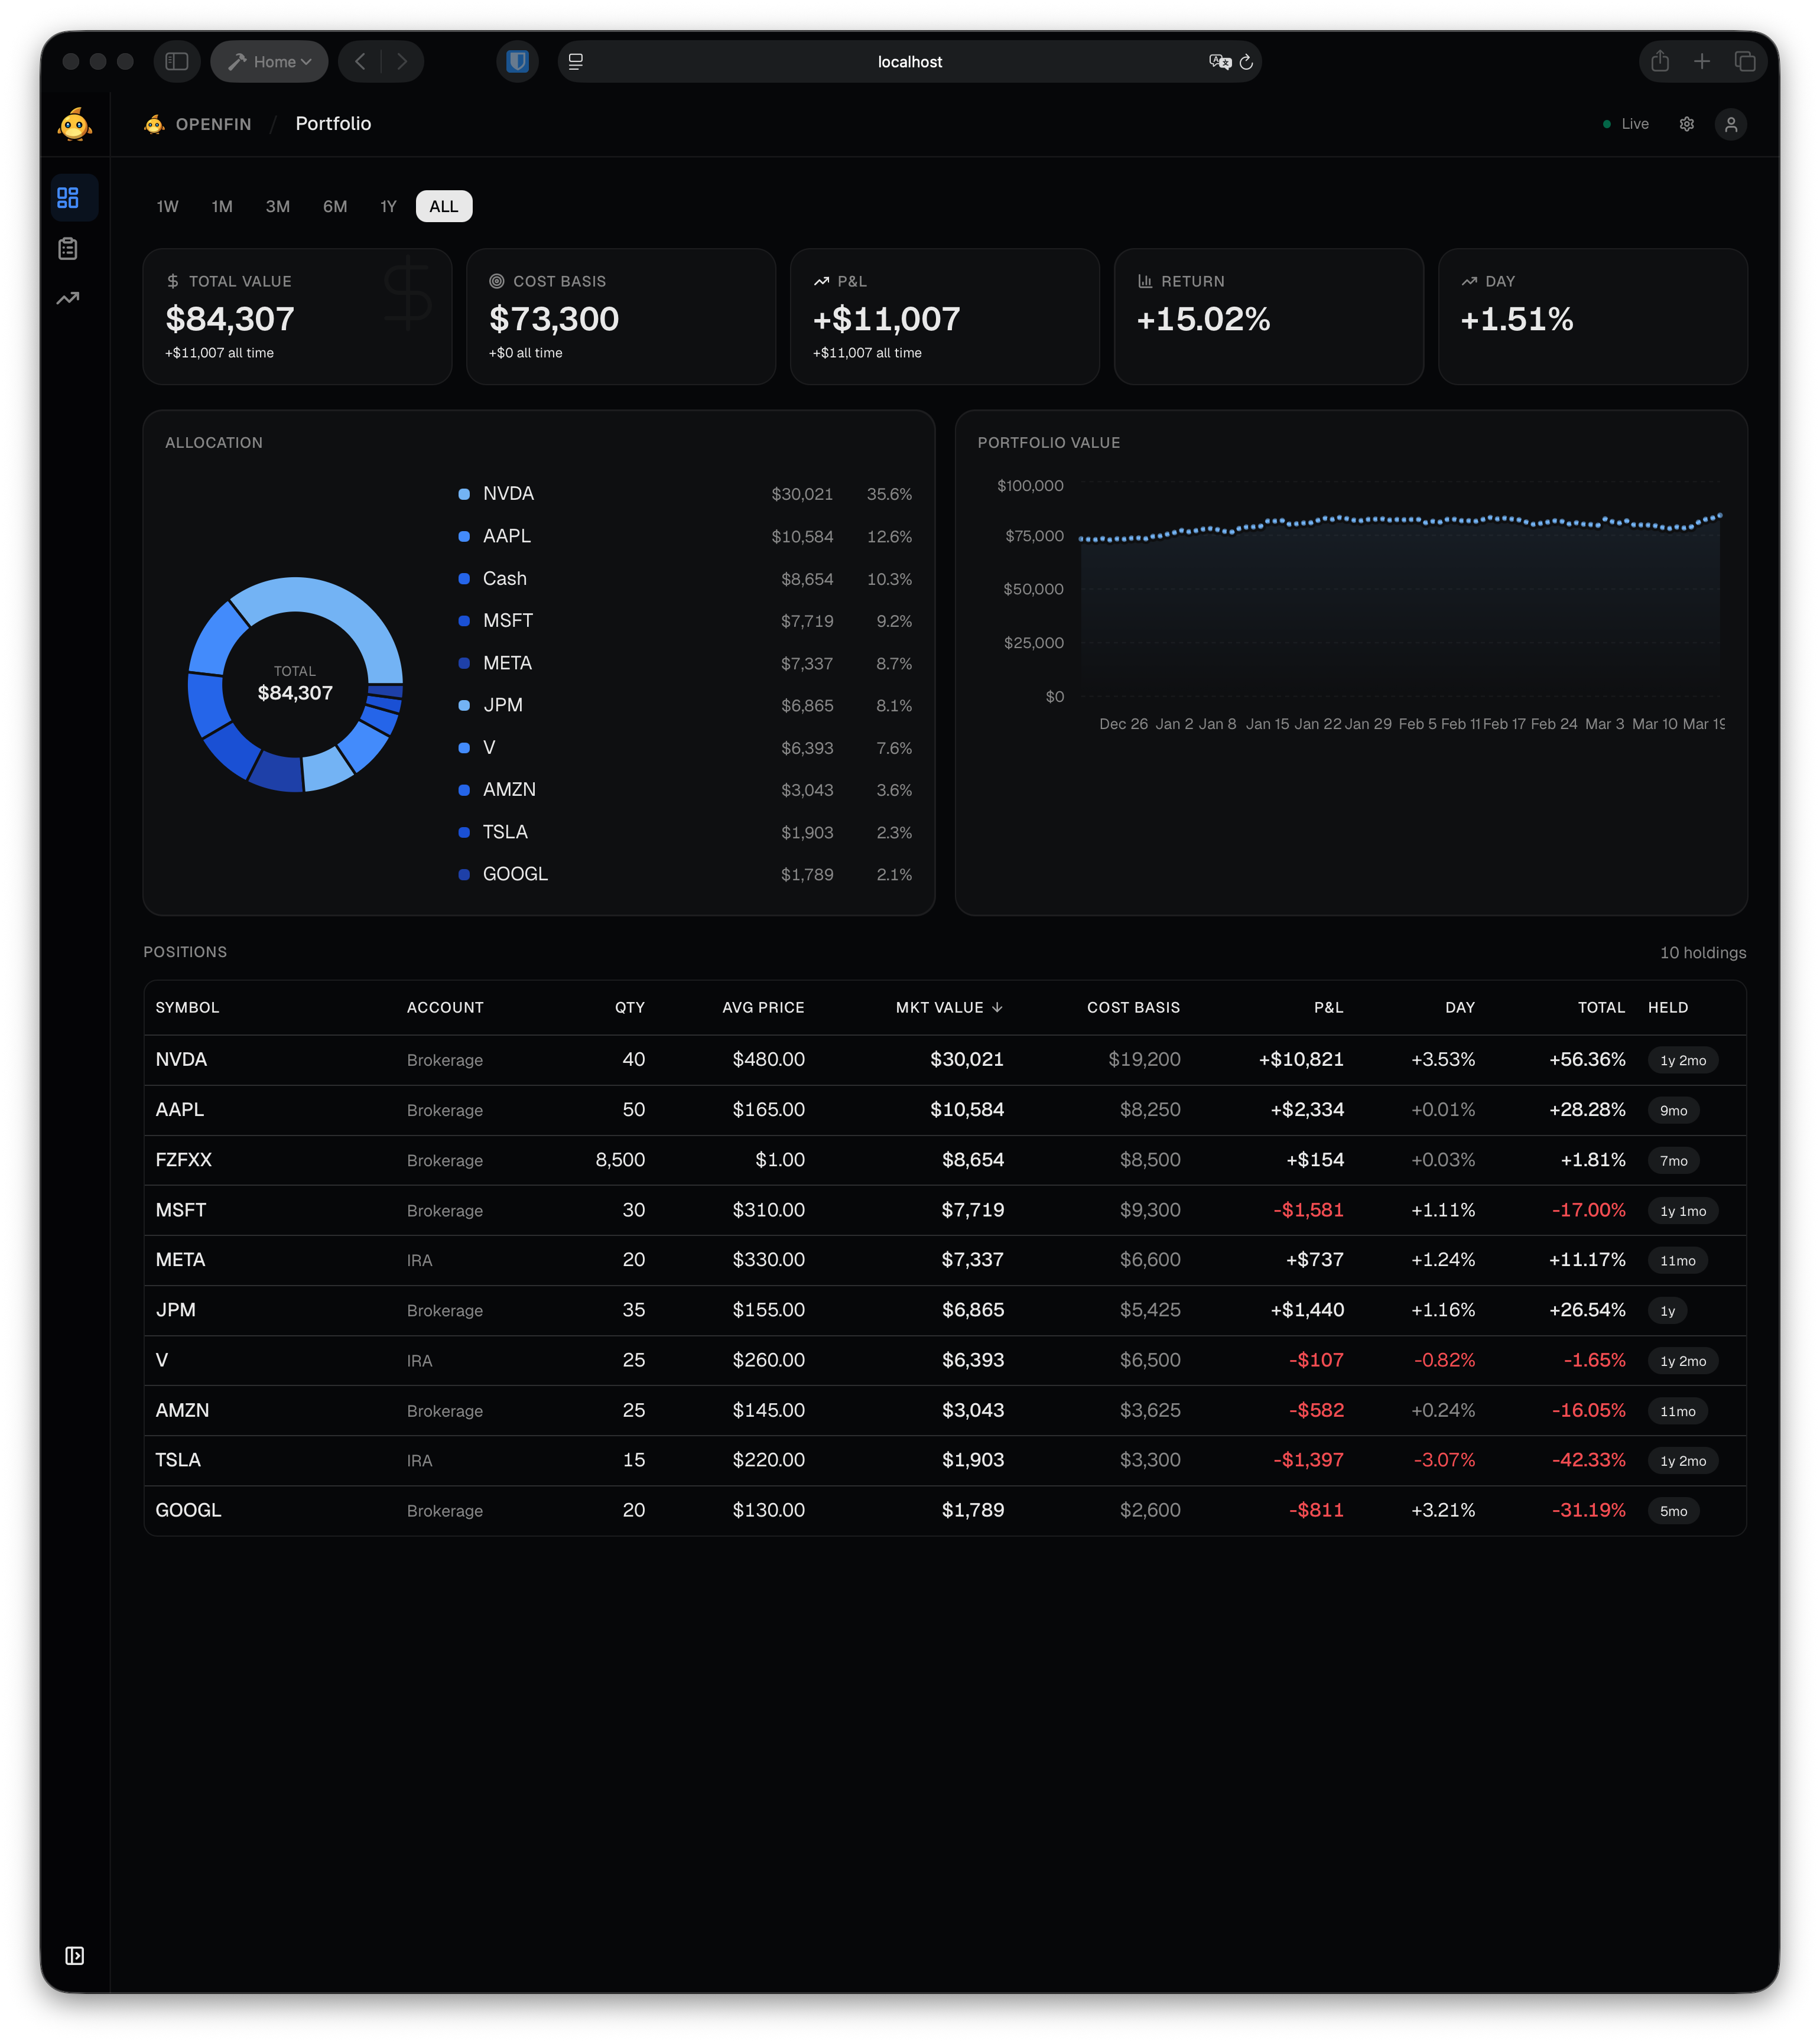
- KPI cards — total value, cost basis, P&L, return %, and day change across the full portfolio.
- Horizon picker — toggle between 1W, 1M, 3M, 6M, 1Y, and ALL to scope the KPIs and trend chart to a time window.
- Allocation chart — donut breakdown of holdings by market value.
- Portfolio value trend — historical portfolio value over the selected horizon.
- Positions table — every holding with symbol, account, quantity, average price, market value, cost basis, P&L, day change, total return, and hold duration.
Reviews
Browse past weekly review runs and their outputs.
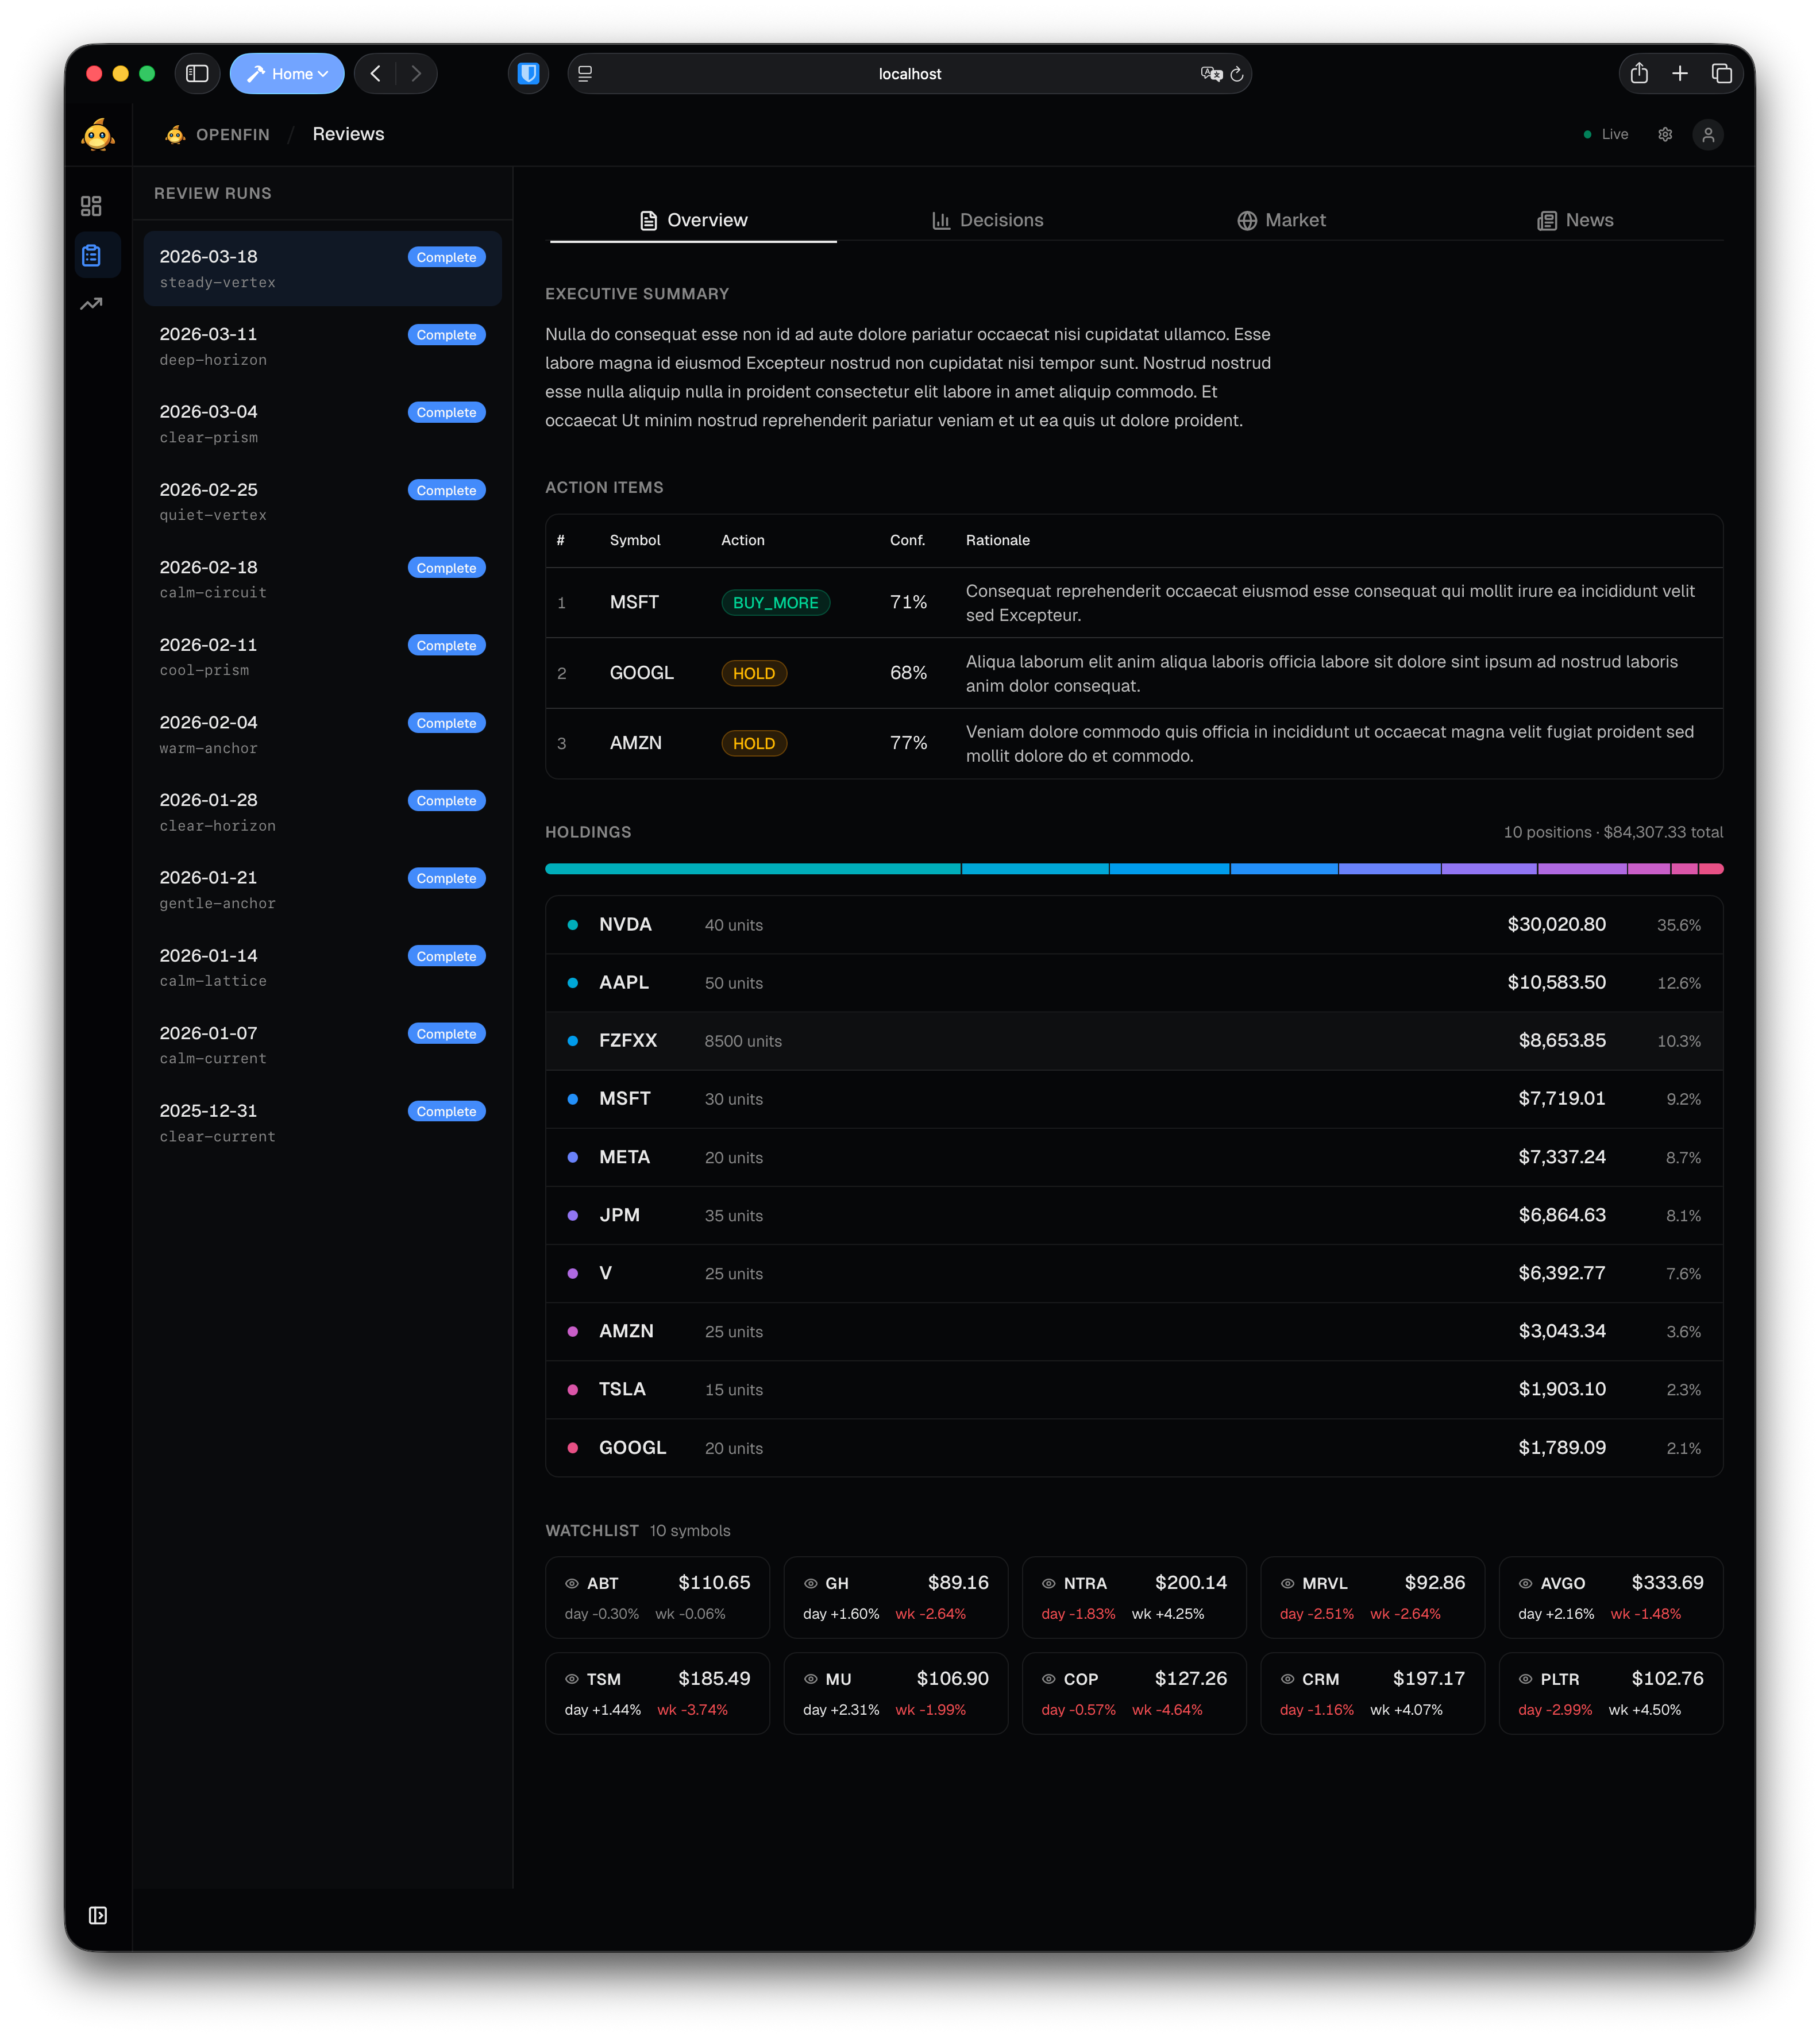
- Run list (left sidebar) — chronological list of all review runs with date and label. Click a run to open it.
- Overview tab — executive summary, action items (symbol, action, conviction, rationale), current holdings bar, and watchlist ticker strip with price/change.
- Decisions tab — per-symbol scoring decisions from the review.
- Market tab — market and macro context captured during the run.
- News tab — news articles collected for the run.
Symbols
Drill into the raw data history for any tracked symbol.
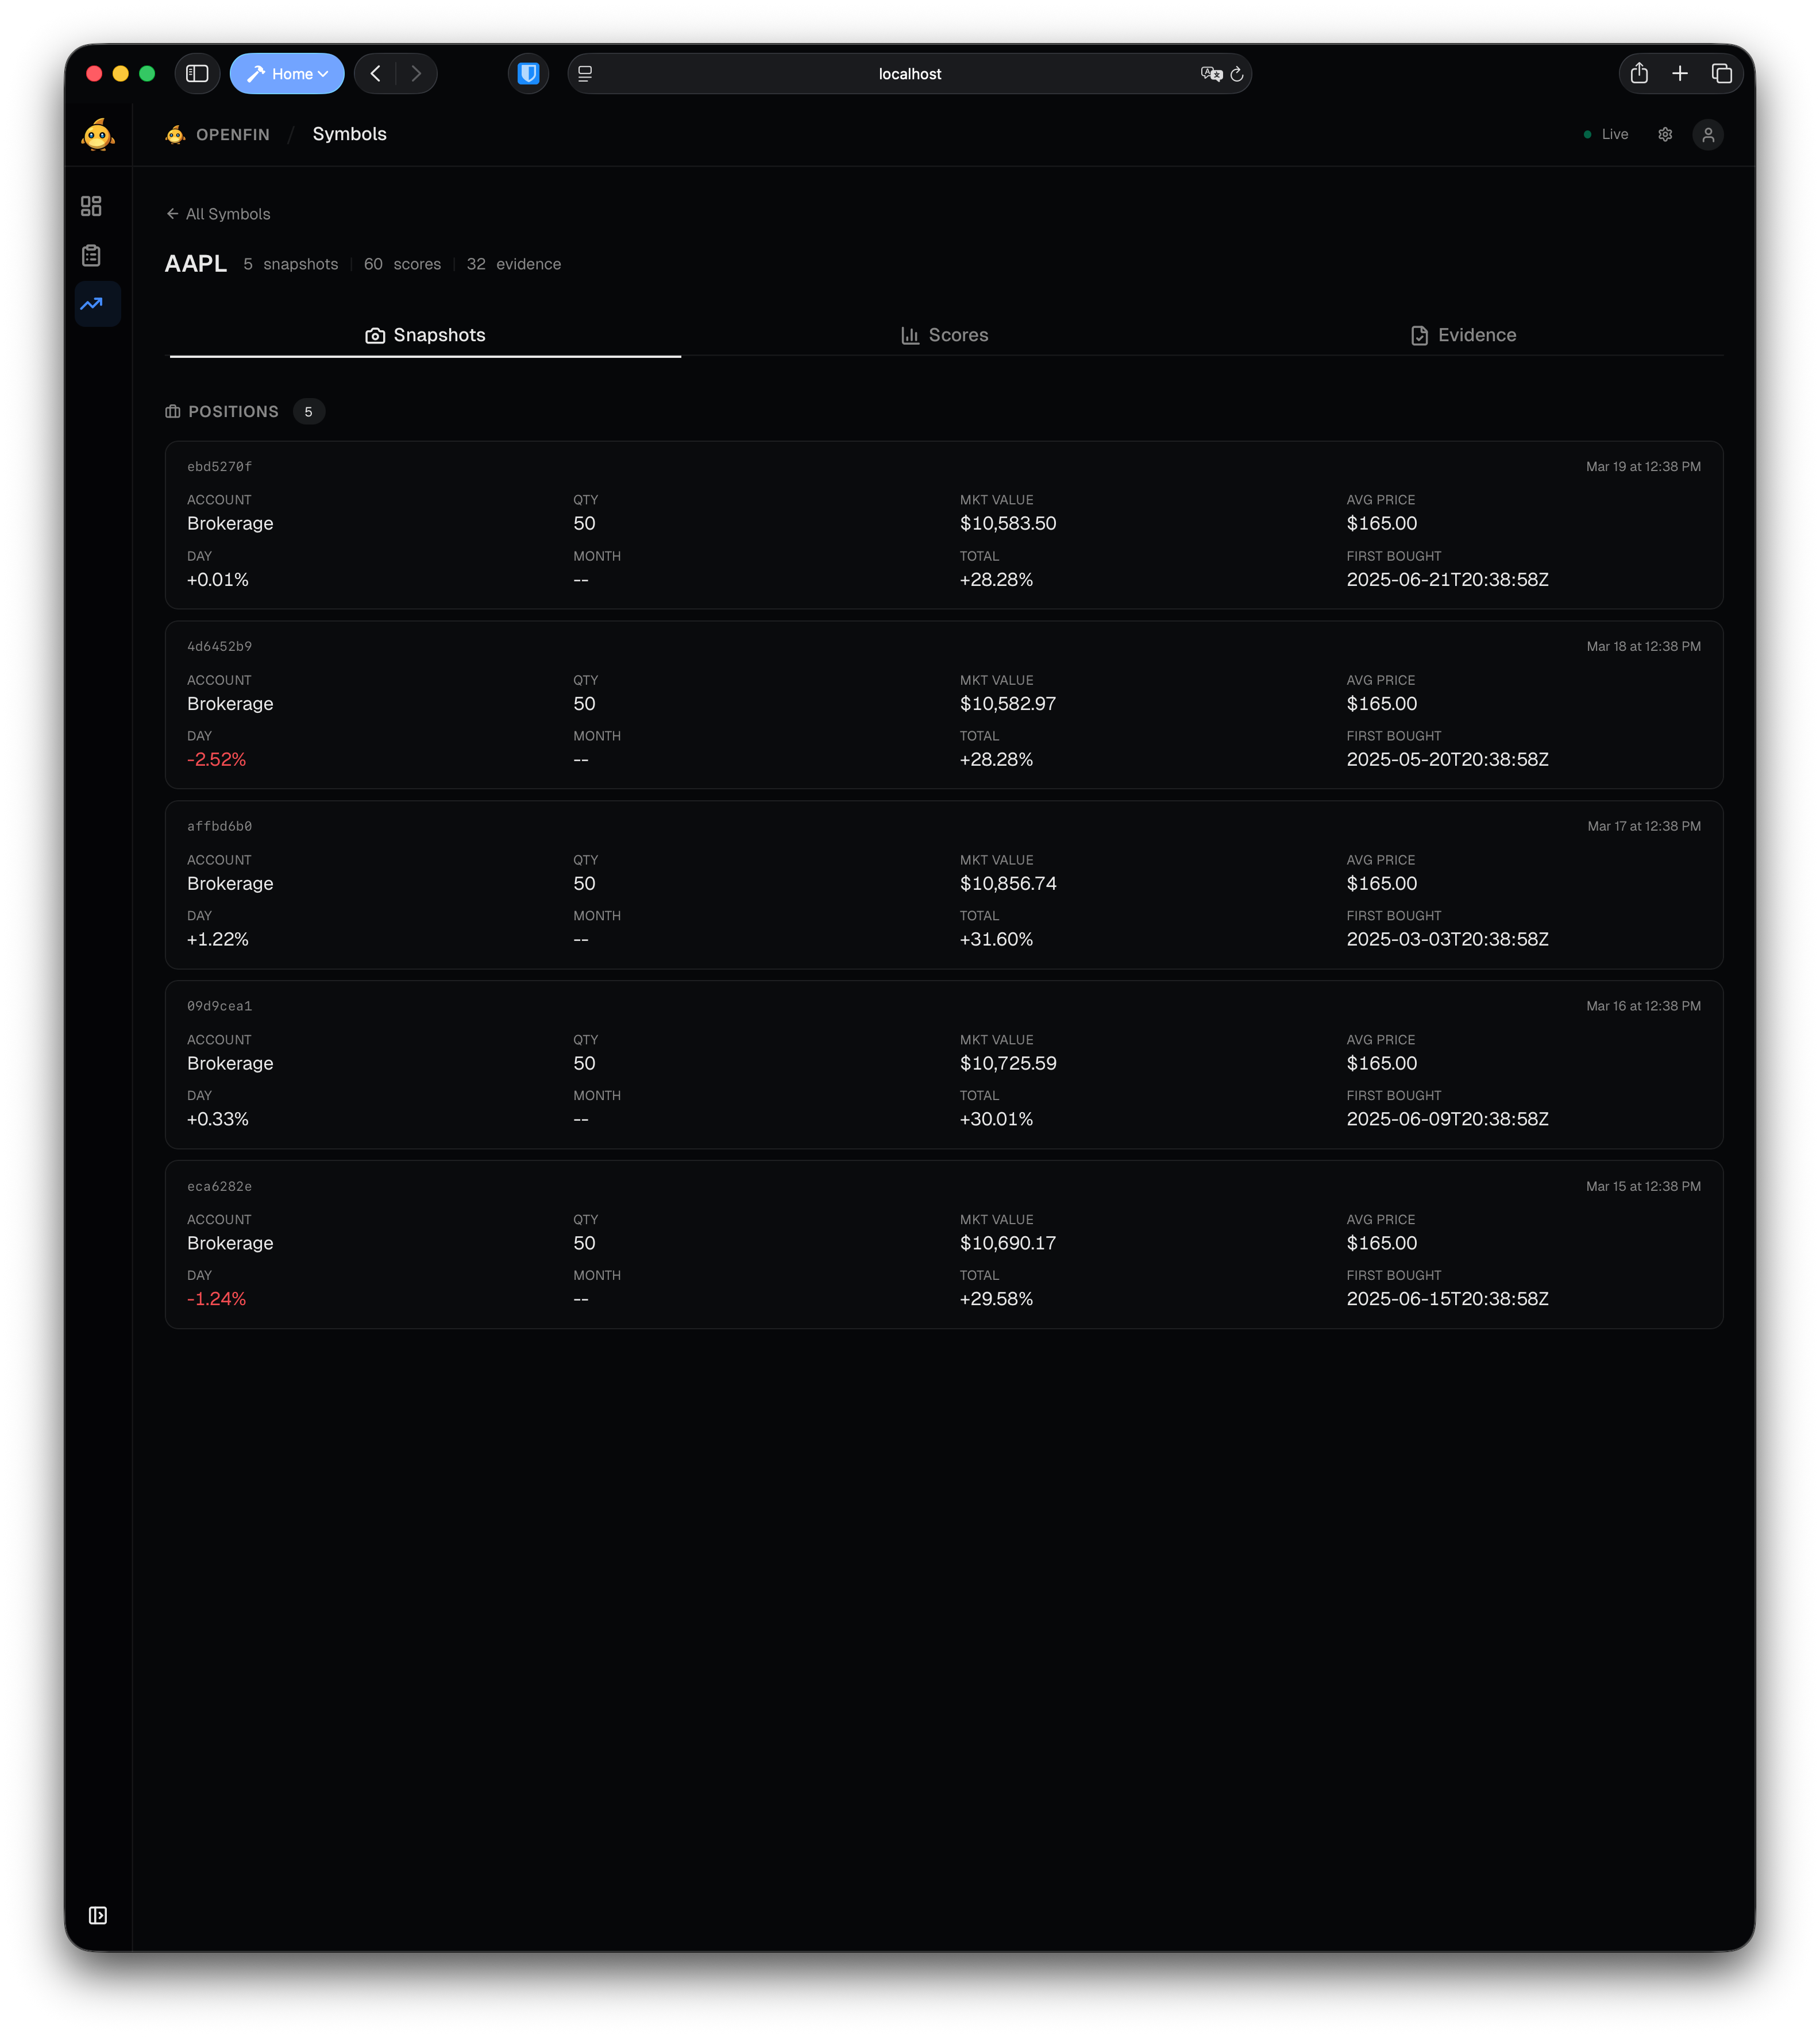
The symbols index (/symbols) lists all symbols in the database with snapshot counts, score counts, evidence counts, latest composite score, and action. Click a row to open the detail page.
The detail page (/symbols/:ticker) has three tabs:
- Snapshots — grouped by data type (positions, quotes, news, earnings, watchlist). Each card shows the batch ID, timestamp, and structured payload.
- Scores — rubric score history grouped by review run. Shows per-metric scores, rationale, composite score, and recommended action.
- Evidence — decision evidence records with source type, attribution, claim text, and source URL.
Navigation
The sidebar on the left provides navigation between views. It can be collapsed to an icon-only strip by clicking the toggle. The header shows the current view name and a live/offline indicator for the API connection.